
Global Model Configuration
- Code
- Model
- Initialization
- Cases
- Verification
- Diagnostics
Codes Employed
The components of the end-to-end forecast system used in the convective parameterization testing included:
• NEMS-GSM model [from top of trunk on 15 March 2017 (r89613), but with additions for integrating GF scheme]
• NCEP's Unified Post Processor (v7.3.2)
• Model Evaluation Tools (MET v5.2)
• Python for graphics generation
Scripts and Automation
This test employed a single workflow that includes functionality based on capabilities established by EMC and the GMTB:
• A modified version of EMC's workflow (v3.0.0; r91963), based entirely on the Rocoto Workflow Management System, was used for running the NEMS-based GFS, including setting up environment variables, creating the initial conditions by running GDAS, running the forecast model, post-processing, tracking tropical cyclones, and detecting tropical cyclogenesis.
• The GMTB augmented EMC's workflow to include additional functionality to stage datasets, create forecast graphics, run forecast verification, archive results, and purge the disk.
Control Configuration (SASDA)
| Microphysics: | Zhao-Carr |
| Radiation (LW/SW): | RRTMG |
| Gravity Wave Drag: | Orographic and Convective Gravity Wave Drag |
| PBL: | Hybrid Eddy-diffusivity Mass-flux Scheme |
| Deep Convection: | Scale-Aware Simplified Arakawa-Schubert |
| Shallow Convection: | Mass-Flux based SAS |
Test Configuration (GFDA)
| Microphysics: | Zhao-Carr |
| Radiation (LW/SW): | RRTMG |
| Gravity Wave Drag: | Orographic and Convective Gravity Wave Drag |
| PBL: | Hybrid Eddy-diffusivity Mass-flux Scheme |
| Deep Convection: | Grell-Freitas |
| Shallow Convection: | Grell-Freitas |
Other settings
• Additional configuration parameters used for GFDA:
imid = 0 (mid-level clouds turned off)
ichoice = 0 (deep convection closure option)
ichoice_s = 2 (shallow convection closure option)
dicycle = 1 (diurnal cycle adjustment turned on)
Initial Conditions
Initial conditions (ICs) for cycled runs: The ICs for the cycled runs were generated by running GDAS, which employs an 80-member T254 EnKF on a six-hourly cycle. GDAS was run separately for each model configuration, so initial conditions were consistent with the physics being tested.
Initial conditions (ICs) for non-cycled runs: The analysis files generated from the cycled GFS-SAS runs were used to initialize the GFS-GFcold runs.
Cases Run
• Forecast Date Range: June 1-15, 2016
• Initializations: Daily at 00 UTC
• Forecast Length: 240 hours; output files generated every 6 hours
Verification
The Model Evaluation Tools (MET) package is comprised of:
• Grid-to-point comparisons - Surface and upper-air model data
• Grid-to-grid comparisons - QPF and anomaly correlation
MET was used to generate objective verification statistics, including:
• Root Mean Square Error (RMSE) and mean error (bias) for:
• Surface (CONUS only): temperature (2 m), relative humidity
(2 m), and winds (10 m)
• Upper-air: temperature, relative humidity, and winds
• Equitable Threat Score (ETS) and frequency bias for:
• 6-hr (CONUS only) and 24-hr precipitation accumulations
• Anomaly Correlation (AC) for:
• 500 hPa geopotential height (Northern and Southern
Hemispheres)
Due to GFS-GF being initialized with operational data that uses the scale-aware SAS cumulus parameterization for the first initialization in the test period, the first day of the experiment was discarded from the aggregated verification results.
All three configurations (GFS-SAS, GFS-GF, and GFS-GFcold) were run for the same cases allowing for a pairwise difference methodology to be applied, as appropriate. The CIs on the pairwise differences between statistics objectively determines whether the differences are statistically significant (SS).
Area-averaged verification results were computed for the CONUS domain, CONUS East and West domains, 14 CONUS sub-regions, and global sub-regions.
Tropical Cyclogensis
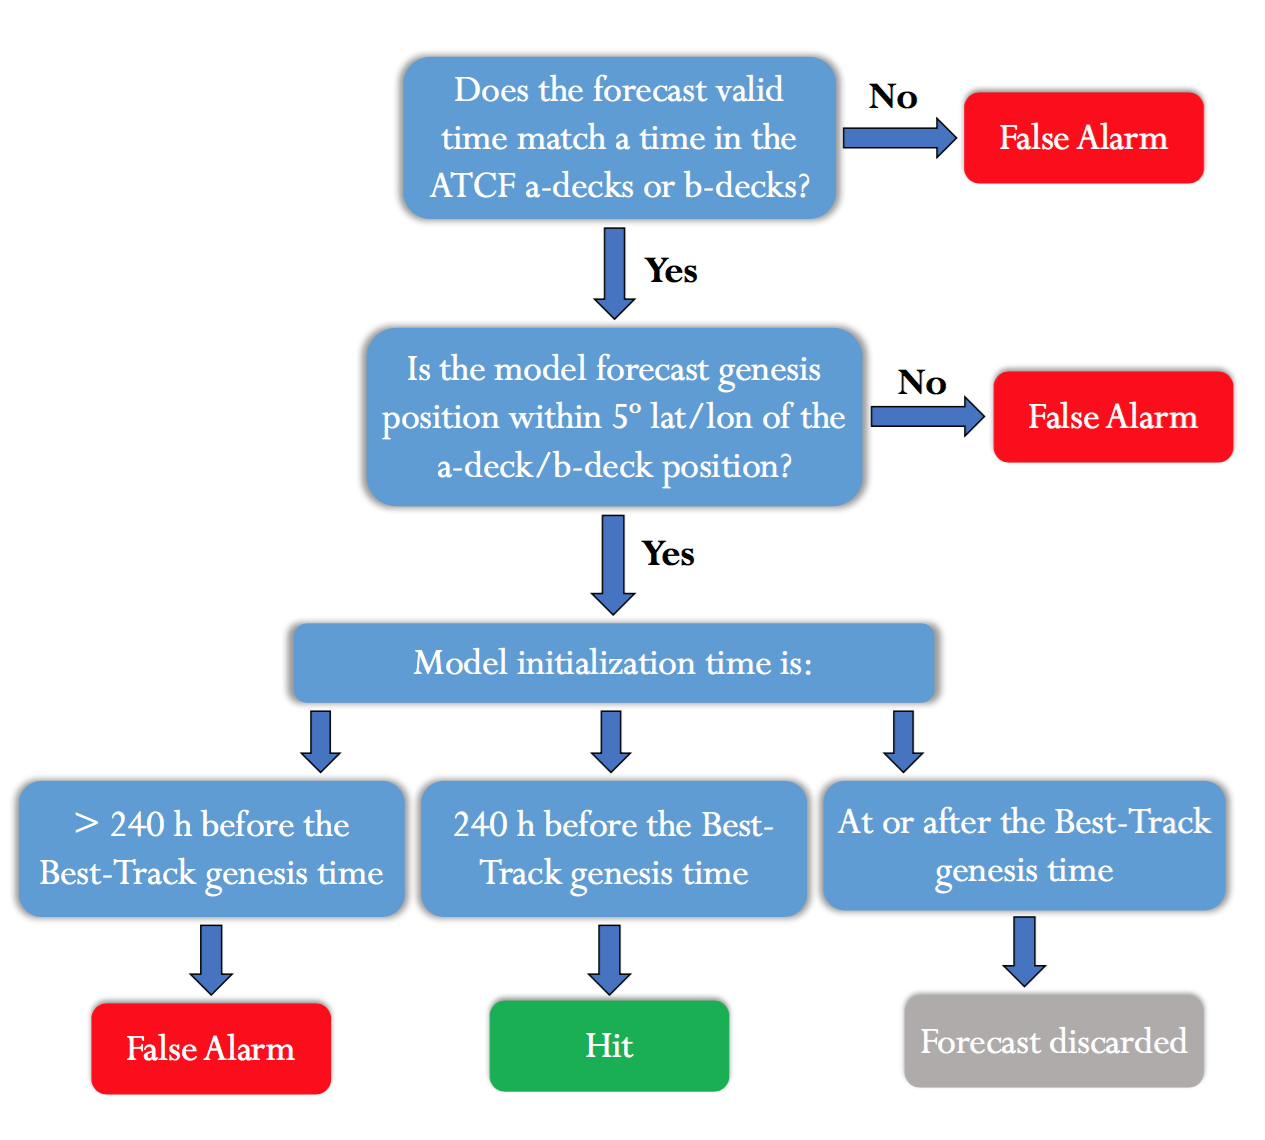
In this test, verification of TCs was restricted to occurrence of genesis because the sample size was too small for verification of track and intensity of observed storms. Model data were available during 2-15 June 2016 from GFS-SAS, GFS-GF, and GFS-GFcold and were compared against observed genesis as reported in the Best Track (BT). TC genesis locations were defined as the first time that NHC or JTWC designated the storm as a tropical depression (TD) or tropical storm (TS). The TC genesis verification criteria used in Halperin et al. (2016) was utilized with a slight modification. Here, a successful genesis forecast (i.e., hit) was defined when observed genesis occurred within 240 h of the model initialization time and when the forecast genesis was within 5 deg of latitude and longitude of the BT location at the corresponding time. For model genesis forecasts with valid times prior to the BT genesis time, Combined Automated Response to Query (CARQ) entries in the Automated Tropical Cyclone Forecasting (ATCF) system a-deck files were used to verify the forecast TC location. Genesis forecasts that were not observed, or that were present in the CARQ but not in the BT, was classified as false alarms. The modified TC genesis verification is shown in the diagram here.
Other diagnostics
The GMTB also included a number of new diagnostics to better understand and diagnose the impacts of the differing cumulus schemes on the resulting forecasts. Diagnostics such as area-averaged precipitation accumulation, precipitation partition, cloud fraction at low-, middle-, and high-levels, water budget components, and long- and short-wave radiation at the surface and top of atmosphere over specified regions (e.g., whole globe and Amazon) were calculated and plotted for the 10 June 2016 initialization. Comparisons were made both against CMORPH TMPA version 7 (Huffman et al. 2010). Using the case study approach, these additional diagnostics helped tie results from the SCM to the aggregated verification results, as well as provide further insight to the configurations behavior. To see examples of the diagnostics created, please see the final report.