
Mean State Bias of Precipitation
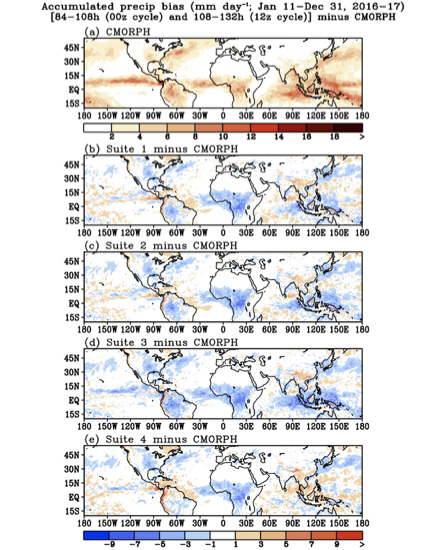
The model simulated precipitation was compared with the daily averaged 0.25º x 0.25º Climate Prediction Center (CPC) morphing technique (CMORPH) precipitation analyses. The figure below shows all four suites are associated with dry biases over the African monsoon region and the Central U.S. Suites 1, 2, and 3 also underpredict precipitation over the Indo-Pacific warm pool and the Amazon tropical rainforest. On the other hand, Suites 1, 2, and 4 slightly overestimate rainfall over the Caribbean Sea and the equatorial Atlantic, and Suite 4 has a wet bias over the Indo-Pacific warm pool.
More results can be found at:
GMTB's Final Report
Tar file of results