
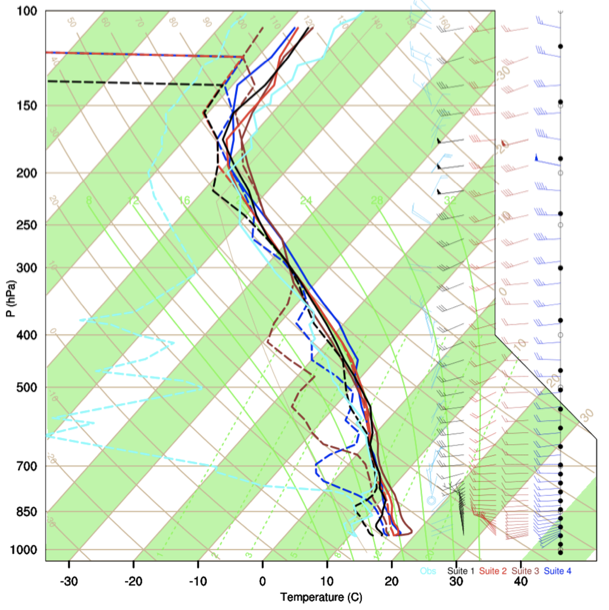
Skew-T Log-P Diagrams
The skew-T log-P diagram was used to visualize and compare the vertical profiles of temperature, dew point and wind in forecasts from all four suites against the observations. Atmospheric characteristics, such as saturation, atmospheric instability, wind shear, and convective available potential energy (CAPE), were also analyzed.
The figure below is an example for Blackburg, VA for the 10-day forecast initialized on 01/10/2015 at 00 UTC. Suites 1, 2, 3, and 4 are in black, red, brown, and blue, respectively, while the observation is in cyan.
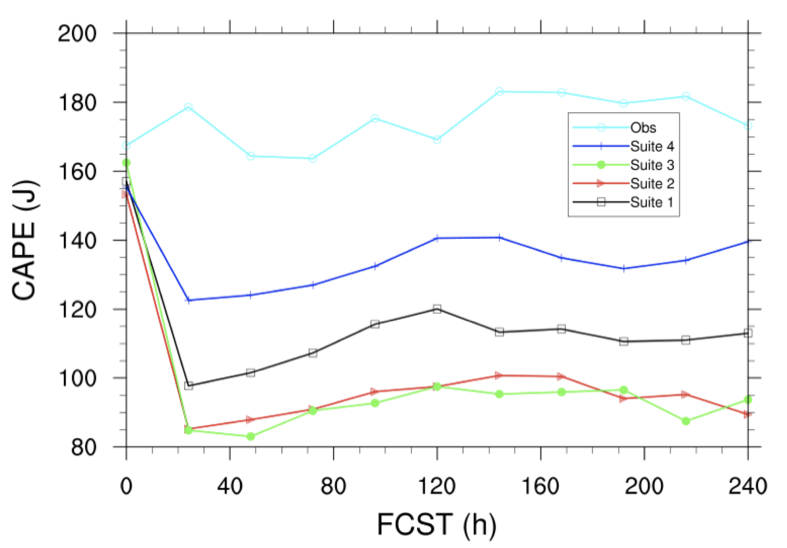
Properties of the soundings were computed. The figure below shows CAPE averaged over CONUS valid at 12 UTC for all forecasts. Suites 1, 2, 3, and 4 are in black, red, green, and blue, respectively, while the observation is in cyan.
More results can be found at:
GMTB's Final Report
Tar file of skew-t log-p diagrams and associated analyzed fields